
Ever wonder why some marketing investments feel like buying lottery tickets while others deliver measurable results? Throwing money at partnerships without tracking returns is like betting on longshots. It’s exciting in theory but financially questionable in practice.
The smartest brands approach these investments with Moneyball precision, not Hail Mary hope. They know that proper measurement turns vague “exposure” into concrete business intelligence.
Tracking sponsorship ROI gives you the complete picture for data-driven decisions. It’s the difference between strategic marketing and expensive guesswork. When the CFO asks for results, “we got some logo placement” just won’t do anymore.
In today’s analytical landscape, understanding your investment performance is key to survival. Let’s dive into how to measure what matters and build partnerships that deliver.
Key Metrics for Online Engagement
If sponsorship measurement were a dating app, online activation metrics would be your super-like feature. They help you find meaningful connections in the digital world. Think of them as your brand’s way to know who’s interested and ready to commit.
There are three key metrics: audience reach, media exposure value, and brand interaction. Each shows a different part of your sponsorship story. Together, they prove your marketing dollars are worth it.
Audience Reach
Audience reach is about how many people see your content. It’s like casting a wide net to catch as many fish as possible. But, it’s not always accurate.
Reach numbers can be misleading. They count everyone who sees your ad, even if they’re not really paying attention. The Los Angeles Lakers track real engagement, not just presence.
Media Exposure Value
This metric turns views into dollars. It calculates how much your brand is worth in different places. It answers the question: “What’s my brand’s value?”
It’s like turning likes into money. When your logo appears in a big game or on social media, this metric shows its value. It makes budget meetings easier for everyone.
Brand Interaction
Brand interaction shows real engagement. It counts likes, shares, website visits, and more. It tells you if people actually care about your brand.
The Lakers track engagement closely. They see how social media reacts during games and how many people download apps after events. This shows if your brand is memorable.
In the world of online activation metrics, what you measure, you can manage. These three metrics help you understand if your sponsorship is making a difference.
Pre-Event Benchmarking
Ever try to measure your golf score without knowing par? That’s like sponsoring events without benchmarking. You’re swinging blindly, while others know exactly what to do.
Smart brands check the weather before an outdoor event. You wouldn’t go to Wimbledon without an umbrella, right? So, don’t sponsor without knowing what’s normal in your industry.
- Competitor performance at similar events
- Historical data from previous years
- Industry-standard engagement rates
This isn’t about copying others. It’s about knowing the field before you play. Without context, you’re just measuring against your own hopes. And we all think our ideas are great.
The best pre-event benchmarking is strategic:
| Benchmark Type | Data Sources | Key Insights |
|---|---|---|
| Competitor Analysis | Social media metrics, press coverage | Industry engagement benchmarks |
| Historical Trends | Past event performance data | Seasonal engagement patterns |
| Market Research | Audience surveys, industry reports | Expectation vs reality gaps |
This turns vague hopes into clear targets. Instead of “we want more engagement,” you can say “we aim for 15% above industry standard based on last year’s data.”
Good benchmarking doesn’t limit ambition. It grounds it in reality. The goal is to set accurate expectations you can measure against.
Remember, the most valuable engagement measurement is knowing success before you start. Without it, you’re just celebrating participation trophies.
Digital Monitoring Tools
Ever tried to navigate New York traffic with a 1990s paper map? That’s what measuring sponsorship ROI feels like without digital tools. We’re in a new era of real-time tracking and precise analytics.
Modern sponsorship isn’t just about putting logos on stadiums and hoping. It’s about knowing which social media mention led to sales. Which fan interaction boosted revenue. Which moment made your investment worth it.
Platforms like Wehave’s data system turn sponsorship into a science. They track everything – from social buzz to conversion paths. And they show it all in clear dashboards.
Consider this real-world magic: one brand made $5.5 million from fan-generated revenue, spending only $2 million on sponsorships. That’s not just ROI – it’s financial magic. The secret? Digital monitoring that links social media to revenue.
These tools don’t just count likes and shares. They answer big questions:
- Which platforms drive the most valuable engagement?
- What content actually converts followers into customers?
- How does sponsorship performance compare to other marketing channels?
The best part? You’re not just collecting data – you’re gaining insights. Real-time monitoring lets you adjust strategies on the fly. Notice a hashtag trending? Double down. See a platform underperforming? Shift resources.
This isn’t about drowning in spreadsheets. It’s about smart data that tells a story – the story of your sponsorship’s success. And in today’s market, not using these tools is like bringing a knife to a drone fight.
Post-Event Analysis (Traffic, Followers, Leads)
The confetti has settled, and the last hashtag has been tweeted. Now, we face the morning-after math. This is where dreams meet spreadsheet reality. We turn those euphoric event moments into cold, hard data that actually means something.
Think of post-event analysis as CSI: Marketing Edition. We’re not just counting likes and shares; we’re connecting digital breadcrumbs to actual business outcomes. The real magic happens when you can trace that Instagram story viewer all the way to a qualified lead.
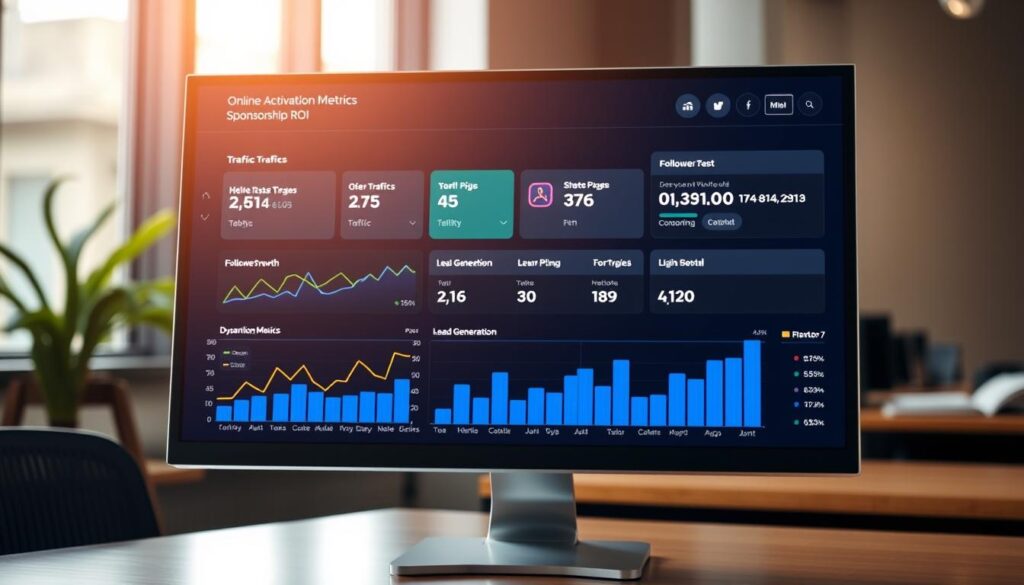
Your website traffic during the event tells a story more dramatic than any Netflix series. We’re looking for those Mount Everest spikes that scream “people actually cared!” But traffic without conversion is just digital window shopping – we need to see who actually bought something.
Social media metrics reveal the emotional pulse of your sponsorship. Follower growth matters, but engagement rates matter more. Did people just click “follow” or did they actually comment, share, and become evangelists?
The holy grail? Connecting social buzz to actual sales. Promo codes and dedicated landing pages become your forensic evidence. That 20% discount code shared during the keynote? That’s not just a coupon – it’s a direct line from brand awareness to revenue.
Surveys measure what numbers can’t: brand recall and emotional connection. Because let’s be honest – someone might remember your brand without being able to explain why. That’s the sponsorship equivalent of catching feelings.
True online activation metrics don’t just measure activity; they measure impact. They answer the question every CFO secretly asks: “That party looked fun, but did it actually make us money?”
The most beautiful moment? When the data shows that woman who liked your tweet later used your promo code to make a purchase. That’s not a metric – that’s a success story with receipts.
Optimizing Sponsor Value
Measuring sponsorship performance isn’t just about collecting trophies. It’s about finding the relationships worth keeping. We turn raw data into strategic advantage.
Imagine being a baseball general manager at the trade deadline. You don’t keep players for their smiles. You look at their stats and make tough decisions based on numbers.
Customer Lifetime Value is your secret weapon. CLV shows you who’s likely to stick around. It’s the difference between a one-night stand and a lasting relationship.
Smart brands compare CLV to find lasting value in partnerships. Sometimes, the flashiest events bring the least valuable audience.
This data-driven approach gives you leverage in negotiations. When you show strong Return on Sponsorship Investment (ROSI), you’re not just asking for better terms. You’re presenting solid evidence.
Here’s how top performers optimize sponsorships:
| Sponsorship Type | Average CLV Increase | ROSI Score | Renewal Priority |
|---|---|---|---|
| Industry Conferences | 18% | 8.7/10 | High |
| Sports Events | 22% | 9.2/10 | Critical |
| Music Festivals | 9% | 6.4/10 | Low |
| Community Events | 15% | 7.8/10 | Medium |
The table shows the truth. Sports events consistently bring higher-value customers. This engagement measurement helps us see who’s truly valuable.
Optimization means knowing when to invest more and when to move on. It’s about recognizing some sponsorships are forgettable, like bad reality TV.
The best partnerships offer compound returns. They’re not just transactions; they’re investments in lasting relationships.
Reporting & Insights
Most sponsorship reports are as exciting as a tax document. They’re like the broccoli of marketing: good but boring. We aim to make them as engaging as a gourmet dish.
Great reporting turns data into stories. You’re like a Shakespeare of spreadsheets, a Hemingway of hashtags. Your task is to show how investments turned into results.

Customizing reports makes each sponsor feel special. In today’s world, generic reports get ignored.
Your report needs three key parts:
- Valuation and performance comparison – Show what they got for their money
- Customized insights – Talk their language, meet their goals
- Proof of promises delivered – Use metrics that prove your points
Remember that awful 50-page reading assignment before finals? Don’t make your reports like that.
Create summaries that grab attention like a strong coffee. Lead with the wins, back it up with data, and always tie it to business goals. If you can’t show how it helped, it’s just decoration.
Making complex data simple is an art. It’s like explaining quantum physics with emojis – it’s tough but doable.
Your ROI reports should answer one big question: “Was this worth our money?” Everything else is just extra.
Insights need to lead to action. They’re like a GPS that shows where you’ve been and where to go next. Always suggest next steps and ways to improve.
Reporting isn’t just about showing you did your job. It’s about proving their investment was smart. When you do this well, you ensure more success to report on.
Lessons from Major Events
Ever wonder why the NBA Finals feel less like basketball and more like a live-action marketing thesis? Major sporting events have become the Harvard Business School of sponsorship measurement. They teach us that success isn’t measured in points but in pixels and percentages.
The 2023 NBA Finals offered a masterclass in online activation metrics. Sponsors didn’t just count how many times their logos appeared on screen. They measured exact visibility seconds, calculated engagement rates during those moments, and tracked how digital conversations spiked with each appearance. It’s like Moneyball for marketing, but with more champagne showers.
Take the Los Angeles Lakers’ approach: they use analytics so advanced they could probably predict LeBron’s next career move. They measure everything from how long viewers engage with branded content to which sponsorship elements drive actual conversions. It’s not enough to be seen – you need to be remembered and acted upon.
What can smaller events learn from these billion-dollar laboratories?
| Big Event Strategy | Scalable Tactic | Key Metric |
|---|---|---|
| Logo visibility tracking | Social media mention monitoring | Engagement rate per exposure |
| Real-time sentiment analysis | Post-event survey implementation | Brand sentiment shift |
| Multi-platform engagement correlation | Cross-channel performance comparison | Conversion attribution |
The beauty of these approaches? They’re not just for organizations with NASA-level budgets. The principles of effective sponsorship measurement work whether you’re sponsoring the Super Bowl or a local charity 5K. It’s all about asking the right questions and tracking the right data points.
Want to implement these big-league strategies? Our guide on measuring event sponsorship ROI shows how to apply these principles to events of any scale.
The ultimate lesson from major events? Stop guessing and start measuring. Your sponsors will thank you – and probably renew their contracts.
Conclusion
We’ve looked at everything from audience reach to post-event analysis. The game has changed from just buying visibility to making a real impact.
Today, engagement measurement is about getting ready for the future, not justifying past spending. The top brands prepare for sponsorship like a sports team prepares for the playoffs. They study every detail to get better tomorrow.
Advanced tools have made sponsorship more scientific than artistic. We’ve moved from just counting views to tracking real connections that help businesses grow.
The best companies use sponsorship data like the movie Moneyball did for baseball. They find important metrics that others miss, gaining a big advantage.
Your sponsorship plan should be as strong as a rookie in training camp. With the right approach, you’re not just showing ROI. You’re building a top-notch marketing team.