

The confetti settles. The crowd’s roar fades to an echo. Now comes the real test: was it worth it?
That post-game feeling—equal parts triumph and dread—is familiar to anyone who’s poured resources into a spectacle. You’re left with receipts, data points, and a nagging question about actual value. This isn’t just bean-counting; it’s forensic storytelling.
True event return on investment moves far beyond the basic “revenue minus costs” cliché. In today’s landscape, a viral tweet can hold as much weight as a ticket stub. Brand loyalty is the new currency.
We’re talking about proving that energy translated into more than just decibels. It’s about building a compelling case for your gathering’s existence, where every engagement metric and sponsorship dollar serves as evidence.
This section cuts through the noise. We’ll define what success really means when intangible benefits like audience connection weigh as heavily as pure profit. Let’s dissect the anatomy of value, because if you can’t measure it, did it even happen?
Revenue Stream Analysis
Revenue in sports marketing isn’t just one thing. It’s a mix of different sources, each with its own story. The total amount in your bank account is just the sum. The real insight comes from seeing which parts of that mix are shining.
Think of it like a game. Knowing you made a profit is like winning. But understanding your revenue streams is like knowing every detail of the game. Was it a last-minute ticket surge? A sponsorship deal that over-delivered? Or those sneaky in-app purchases from your event’s app?
The usual sources are always there. Ticket sales are the base. Sponsorships add the star power. Exhibitor and vendor fees offer support. Concession and merchandise sales are the crowd-pleasers. But tracking them needs more than a simple ledger.
You need to track everything closely. Use promo codes for campaigns. Have dedicated pages for each sponsorship level. Use strong digital analytics to follow fans from social media to checkout. It’s not just about counting money; it’s about connecting dollars to decisions.
Modern tools, like data platforms, make this complex simple. They show how a fan’s interaction with a sponsor leads to a purchase. This turns vague “marketing success” into clear sports marketing ROI.
| Revenue Stream | Primary Metric | Tracking Method | Contribution Insight |
|---|---|---|---|
| Ticket Sales | Gross vs. Net Revenue | Promo codes, tiered pricing analytics | Measures direct fan demand and pricing strategy effectiveness. |
| Sponsorship Fees | Contract Value vs. Delivered Value | Activation-specific landing pages, engagement metrics | Shows if sponsor investment translates to measurable returns. |
| Merchandise & Concessions | Per-Capita Spending | POS system data, RFID wristband tracking | Indicates fan experience quality and on-site engagement. |
| Digital/Data Licensing | New Revenue vs. Cost | App download analytics, data partnership reports | Reveals hidden value in fan data and digital extensions. |
The game has changed. Modern sports marketing ROI gets exciting in hidden areas. Think about the branded app download leading to in-app purchases. Or the VIP experience upsell that turns a $100 ticket into a $500 package. Or the data licensing where fan behavior becomes a new product for sponsors.
Each of these is a unique revenue stream. Your analysis must be able to speak each language. When you can say, “This 15% increase came from our social media campaign targeting young adults,” you’re not just accounting. You’re building a playbook for next season’s financial victory.
So, forget just watching the scoreboard. Get into the financial huddle. Break down each play. Because understanding where your money comes from is the first step in getting more of it.
Cost Structure Breakdown
Looking closely at event spending shows a complex financial picture. Each part adds to the overall cost. Many organizations review events but often ignore the costs.
Ignoring costs is a big mistake. You can’t know your true earnings without facing your expenses. A detailed cost breakdown is like digging through a spreadsheet.
We break down costs into three main groups. Direct costs are the obvious ones. They include things like venue rental and staff wages. You plan for these costs.
Indirect costs are less obvious. They include planning hours and software subscriptions. These costs are often overlooked.
Hidden costs sneak up on you. They include things like overtime pay and unexpected expenses. These costs can hurt your profit margin without you realizing it.
| Cost Type | What It Includes | Why It Matters |
|---|---|---|
| Direct Costs | Venue rental, catering, AV equipment, staff wages, athlete appearance fees, security, permits. | These are the visible, billable expenses that form your budget’s foundation. They’re non-negotiable and easy to track. |
| Indirect Costs | Planning hours, administrative support, software subscriptions, pre-event marketing, travel for planning meetings, client entertainment. | The operational engine behind the scenes. Ignoring these is like valuing a car but forgetting the cost of the engine. |
| Hidden Costs | Overtime pay, waste disposal, last-minute fixes, contingency spending, unplanned vendor fees, post-event cleanup overages. | The unpredictable variables that can quietly erode your profit margin. They turn a good event into a financial question mark. |
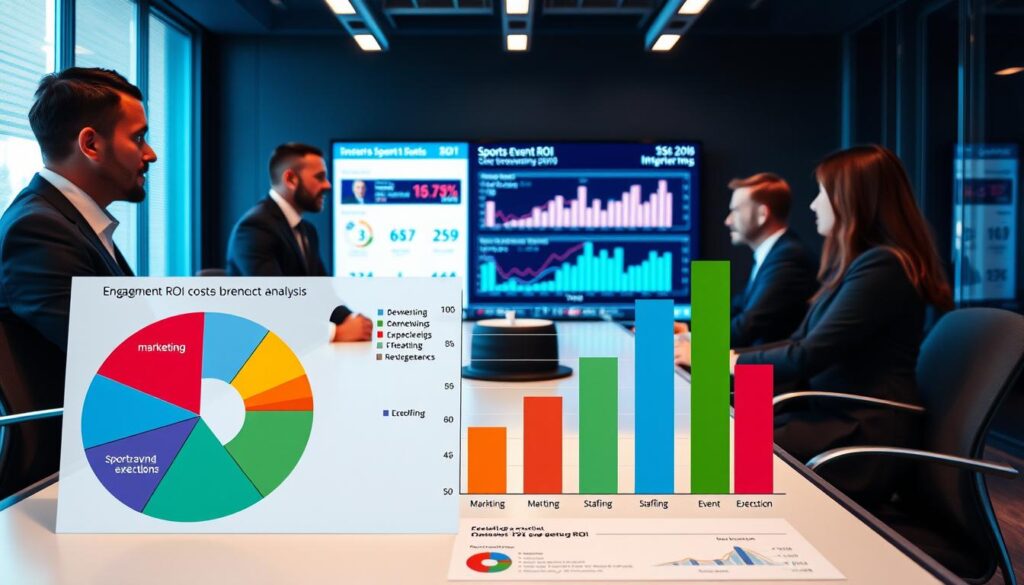
Why is understanding costs important? Many organizations confuse revenue with profit. A $500,000 event with $450,000 in costs might seem profitable. But add in 200 unbilled staff hours, and the profit drops to $50,000.
They also overlook indirect and hidden costs. This isn’t just bad math. It’s strategic blindness. A detailed breakdown turns vague expenses into accountable investments, essential for calculating your true engagement ROI.
Consider the real question: What did you pay for each moment of audience connection? If you only count direct costs, your ROI looks great. Add indirect labor, and it’s respectable. But add hidden costs, and you get the truth.
Knowing your exact cost per attendee lets you measure ROI accurately. Did that $20,000 halftime show generate $50,000 in buzz value? It depends on your total cost basis. The difference is not just numbers. It’s about making smart choices.
The bottom line is brutal honesty. Your cost structure is like a mirror. Don’t look away. The reflection shows what you bought and if it was worth it.
Sponsor Value Calculation
Think of your event sponsors as venture capitalists. They’re not just giving money; they’re betting on your event’s success. They want to see their investment pay off in brand recognition and sales.
The old way of measuring sponsor value is outdated. Today, sponsors want a detailed analysis of their investment. They want to see how their sponsorship translates into real business results.
The ROSI model is key here. It looks at more than just revenue and costs. It considers direct sales, brand lift, and more. The ROSI asks if the partnership was worth it beyond just feeling good.
Let’s look at the tools for valuing sponsors. First, Media Exposure Value (MEV) measures the financial value of logo exposure. Advanced tracking can show exactly how much time a logo is seen and by whom. Was it during a thrilling moment? That’s valuable.
Next, measure direct brand interaction. How many people visited the sponsor’s booth? How many used special codes? This shows that sponsorship leads to action.
Then, look at indirect earnings. This is harder to measure but just as important. Surveys and social listening tools can show if the sponsor’s image improved after the event.
The best analytics use AI to analyze broadcast and social media. They track how sponsor exposure leads to sales. This isn’t just guessing; it’s based on data.
Why is this important for your event return on investment? Sponsorship is often the main source of revenue. Without clear value, sponsors may not invest as much. Calculating sponsor value makes you a strategic partner, not just an event organizer.
Present this data in a way that CFOs can understand. Use tables, charts, and clear ROI percentages. Show them how sponsorship leads to sales. This way, you can keep sponsors and ensure your event’s financial success.
Digital Engagement Valuation
The most important spot in sports today is the screen in your fan’s hand. The buzz, shares, and live reactions are the new currency. But how much is a hashtag worth in sports marketing ROI? We’re moving from counting likes to measuring impact.
Digital engagement is the new frontier where brand love meets data. It includes social media metrics, website traffic, app downloads, and all content interactions. This isn’t just noise. It’s a direct link to higher loyalty and conversion rates.

The challenge is linking online actions to real-world value. A retweet isn’t just a retweet; it’s an endorsement. A deep app session can predict sales better than a billboard. We use analytics and surveys to track and understand these actions.
Let’s dive into the numbers. Let’s value the digital roar of the crowd. The table below shows how to model the real value of digital actions.
| Digital Action | Measurable Metric | Assigned Value Model | Strategic Insight |
|---|---|---|---|
| Social Share (Retweet/Repost) | Extended Reach, Click-through Rate | Earned Media Value (Cost of equivalent ad reach) | Amplifies message credibility through peer networks; a key brand advocacy signal. |
| Live-Stream Comment | Sentiment, Engagement Duration | Brand Health Indicator + Possible Lead Score | Real-time feedback loop; highly engaged commenters are warm leads for community programs. |
| App Session (>5 mins) | Feature Usage, In-App Actions | Predictive Value for Merchandise/ Ticket Sales | Deep engagement correlates directly with commercial intent; a powerful behavioral data point. |
| Sentiment Analysis Peak | Positive/Negative Ratio during Key Moments | Leading Indicator for Brand Perception | Emotional response to a game-winning play or community initiative forecasts broader public opinion. |
This approach turns your dashboard into a control panel. You see website traffic spikes as a captured audience, a moment to convert. Comments on branded videos aren’t just feedback; they’re a real-time focus group.
The goal is to show your digital strategy’s direct link to revenue. By valuing engagement, you stop guessing and start investing. You find out which platforms drive real connection and which metrics are just digital confetti. This is where your sports marketing ROI calculation proves it’s playing in the big leagues, using every tweet, click, and comment to build a smarter, more profitable fan relationship.
Brand Lift Measurement
Revenue shows what people bought; brand lift shows what they believe. It’s the difference between a sale and a change in heart. Ticket sales have a clear value, but how people feel about your team or event is priceless. This is where engagement ROI goes beyond numbers and touches emotions.
Think of your brand as a political candidate in the election of public opinion. Your event is like a campaign rally. Brand lift measures if you won more votes, not just attendees. Did you sway undecideds, energize your supporters, or just speak to the choir?
Brand lift is about measurable changes in how people see your brand after an event. It answers questions money can’t: Are you more memorable? Viewed better? Would people choose you over others? This isn’t just marketing talk—it’s the foundation of lasting value. A fan buying a jersey is good. But a fan defending your team at a bar is priceless.
Measuring this change needs a before-and-after look. You must check the brand’s temperature.
The tools for this are more advanced than a simple applause meter:
- Pre- and Post-Event Surveys: These aren’t your usual “How was your experience?” forms. They’re targeted questions about awareness, consideration, and preference. Did awareness go from 40% to 65%? Did “would consider attending” become “first choice”? This data shows the journey from “seen” to “sought-after.”
- Net Promoter Score (NPS) Tracking: The ultimate test of loyalty. It asks one tough question: “On a scale of 0-10, how likely are you to recommend us?” Promoters (9-10) are your biggest fans. Detractors (0-6) are warning signs. Tracking NPS shows if you’re building a loyal community or just a crowd.
- Media & Social Sentiment Analysis: This is reading the cultural room. Algorithms scan news, tweets, and forums to gauge public emotion. Was the story about your event inspiring or a disaster? Sentiment analysis measures the mood.
Why does this matter for your bottom line? Because how people see you affects their future actions. A positive brand lift means more ticket sales, pricier sponsorships, and more merchandise sales. The engagement ROI here is long-term and valuable. You’re investing in reputation that pays off in the future.
Measuring brand lift is about checking your event’s cultural impact. Did you just entertain for three hours, or did you change the game? Did you create memories or shift allegiances? In sports, where passion is the product, this emotional equity is your most valuable asset. It’s the ROI that whispers long after the crowd’s roar fades.
Long-term Fan Value Assessment
Imagine planting an oak tree instead of buying cut flowers. Most focus on the immediate numbers like ticket sales. But the real event return on investment grows over time, in decades of fan loyalty.
Customer Lifetime Value, or CLV, is key. It’s not just another metric. It asks: What is the total profit from a fan over their lifetime? It looks at the relationship, not just one-time sales.
The math is simple but shows a lot. The CLV formula multiplies the average revenue per customer by their expected lifespan. Then, it adds retention rates. A fan spending $500 a year for 10 years is a $5,000 asset. But if you increase their spend or loyalty, that asset grows.
Your event return on investment thinking needs to change. Are you focusing on the spark or the fire? A one-time buyer is a spark. But a lifelong fan is a fire that warms your finances for years.
Boosting CLV is about consistent, thoughtful retention. It’s like drip irrigation for fandom. Good strategies include:
- Exclusive Content: Give fans behind-the-scenes access and early ticket windows to make them feel special.
- VIP Experience Layers: Offer premium seating and meet-and-greets to increase annual spend.
- Community Building: Create forums and fan clubs to turn a solo activity into a social identity, boosting retention.
Tracking this journey is key. You need systems to follow a fan from their first purchase to their 20th season renewal. Each positive interaction should be seen as an investment in their lifetime value.
The most profitable fan is a retained one. Investing in fan experience and community is a growth strategy. It’s recognizing that the true event return on investment grows quietly over time. That’s how you build a legacy, not just a ledger.
Media Equivalent Value
Media Equivalent Value turns a stadium spotlight into a number your CFO can understand. If a logo appears on screen during a big game but no one values it, did it really happen? This question is at the heart of Advertising Value Equivalency (AVE). It’s key to showing real sports marketing ROI to sponsors who want solid proof of success.
AVE is about translating visible branding into dollars. It asks, “What would it cost to buy this exposure?” Analytics platforms track logo screen time and digital mentions. They compare this to the cost of similar ads.
But AVE has its limits. It’s basic math that doesn’t consider context. Was your logo shown during a win or a scandal? A social mention can be good or bad. The number is the same, but the value is different.
So, modern media valuation needs to be more detailed. To show real sponsorship value, you need to add quality metrics:
- Sentiment Analysis: Was the coverage and social chatter positive, neutral, or negative?
- Contextual Relevance: Did the exposure happen during a key game moment, an interview with a star player, or during a commercial break?
- Audience Quality: Were the impressions from your target demographic or a generic, disinterested crowd?
This detailed approach turns a simple media clip into a valuable asset. It shows that a logo seen during a game-winning drive is more impactful than one seen during a timeout. It’s like the difference between counting trees and assessing the forest’s quality.
Media Equivalent Value isn’t just about finding a number. It’s about making a strong case for your event’s media impact. By combining AVE with context and sentiment, you don’t just report a figure. You tell a story that shows your sports marketing ROI is based on insight, not just math.
Lead Generation ROI
This is where the rubber meets the road. For sports events with corporate suites or B2B ambitions, fan love is nice but signed contracts are better. Measuring Lead Generation ROI transforms handshakes into hard numbers.
Think of it as forensic accounting for relationships. That conversation in the luxury box needs to connect to the purchase order six months later. This is where your engagement ROI gets its final exam grade.
Tools like Salesforce CRM become your evidence locker. You integrate event app data with your sales pipeline. Every scanned badge, every meeting scheduled in the corporate tent—these become data points in a lead’s journey.
Attribution models decide who gets credit. Was it the first email invite? The face-to-face meeting during halftime? The follow-up with game highlights? First-touch, last-touch, or multi-touch models assign value to each interaction.
This is demand generation with cleats on. You’re not just measuring brand warmth anymore. You’re tracking which event touchpoints actually moved leads through the funnel.
Lead scoring helps separate the tire-kickers from the serious buyers. That executive who asked three technical questions during the seventh inning? They get more points than the person who just wanted free merch.
Closing this loop completes your ROI case file. It proves relationships forged in stadium seats have calculable value. The final piece of evidence isn’t a survey or a social media metric—it’s a signed contract with a clear line back to your event. Your engagement ROI now has teeth.