
Nielsen Gauge Data gave media buyers, programmers, and fan marketers a clearer view of how U.S. television attention shifted through the first half of 2026. Confirmed by Nielsen: in Q1 2026, ad-supported television accounted for nearly 73% of all U.S. TV viewing, and streaming services reached a record 46.6% share within that ad-supported category, according to Nielsen’s Q1 2026 Ad Supported Gauge. That does not mean every viewer abandoned traditional TV. It does show that streaming had become a central venue for mass-reach programming, not only a subscription habit.
Market-analysis: the more useful reading is not “streaming won.” The more careful reading is that viewers had become comfortable moving between ad-supported streaming, subscription streaming, live sports, platform originals, and creator-led video experiences on the television screen. For entertainment marketers, that shift changes how campaigns are timed, how fandom is measured, and how event programming is valued after the live moment passes.
Why Nielsen Gauge Data Matters In 2026
Nielsen Gauge Data And The Ad-Supported Shift
The Nielsen Gauge Data is especially useful because it frames streaming within total TV usage rather than treating it as a separate digital category. Confirmed by Nielsen: the Q1 2026 ad-supported measure placed streaming at 46.6% of ad-supported TV viewing. Market-analysis: that figure matters for studios and platforms because ad-supported streaming can now be discussed in the same planning conversation as broadcast and cable, rather than as a side channel for lighter inventory.
Audience implication: ad-supported viewing also changes the cultural contract between platforms and viewers. The consumer trade-off is familiar: viewers accept advertising in exchange for lower-cost or free access. The research provided here does not include subscriber-level pricing or churn data, so it would be unsafe to claim that cost alone caused the viewing shift. What is supported is that ad-supported TV viewing was very large in Q1 2026, and that streaming held a record share inside that category.
That finding connects with a broader SiteBob analysis of ad-supported subscriptions, where price-aware viewing and ad acceptance were treated as core issues for streaming strategy. The Nielsen data does not prove viewer satisfaction. It does show that ad-supported environments were not marginal in early 2026.
Confirmed Events That Helped Concentrate Attention
Confirmed by Nielsen: Q1 2026 streaming gains inside ad-supported TV were driven in part by marquee programming, including NBCU’s Super Bowl simulcast, the Winter Olympics on Peacock, Amazon’s NFL playoff games, and originals such as Stranger Things on Netflix, Landman on Paramount+, and The Pitt on HBO Max. As of October 5, 2026, those Q1 programming examples had already occurred, so they are best read retrospectively as evidence of how event-scale programming affected audience distribution during that quarter.
Market-analysis: the mix is instructive. Sports, franchise television, and premium scripted series can all help streaming platforms claim TV-screen time. That mix also complicates fan engagement. A sports event concentrates attention at a fixed time. A scripted series may build conversation over release windows, social clips, recaps, and recommendations. For marketers, the common point is not format. It is whether the program creates enough shared attention to justify stronger sponsorship, cross-platform promotion, and retention campaigns.
What The Q1 Ad-Supported Shift Revealed
Ad Inventory Followed Attention
Confirmed: the research states that ad-supported television represented nearly 73% of all U.S. TV viewing in Q1 2026. Market-analysis: that is an audience-scale figure, not just an advertising sales talking point. If almost three-quarters of viewing sits in ad-supported environments, then fan marketing around entertainment releases, sports rights, and live event extensions must treat ads as part of the viewer experience rather than an interruption that exists outside the content strategy.
Audience implication: this is where ad load, creative frequency, and platform context become cultural issues. Viewers may accept ads, but that does not mean they respond equally to every placement. A fan watching a high-stakes sports event, a reality finale, or a prestige drama may bring different levels of attention and tolerance. Nielsen’s figures confirm the scale of ad-supported viewing, but they do not identify emotional response. That gap is where brand lift studies, surveys, and platform-level retention data remain necessary.
For event marketers, the Q1 examples show why streaming can carry both appointment viewing and on-demand follow-up. The Super Bowl simulcast and Olympic coverage supported live attention. Series such as Stranger Things, Landman, and The Pitt supported another kind of audience behavior: extended engagement around episodes, characters, creators, and social discussion. The same ad-supported system can serve both patterns, but the creative strategy should differ.
May 2026 Streaming Shares And Platform Power
Streaming Approached Half Of TV Watch-Time
Confirmed by Nielsen: for May 2026, covering April 27 through May 31, streaming made up 48.6% of total U.S. TV watch-time, up 1.0 percentage point from April, according to Nielsen’s Gauge. The same research lists YouTube at 13.8% of total TV watch-time, Netflix at 8.0%, Disney’s services at 4.9%, and Prime Video at a record 4.5% share during May 2026.
| May 2026 Measure | Confirmed Share | Audience Reading |
|---|---|---|
| Total streaming | 48.6% | Streaming was close to half of U.S. TV watch-time. |
| YouTube | 13.8% | Creator-led and platform-native video had major TV-screen presence. |
| Netflix | 8.0% | Subscription streaming remained a leading viewing source. |
| Prime Video | 4.5% | Nielsen attributed the record share to live sports and originals. |
Confirmed: the May platform list also included The Roku Channel at 3.1%, Paramount Streaming at 2.3%, Peacock at 1.8%, and Warner Bros. Discovery services at 1.5%. Market-analysis: the spread shows a two-tier pattern. A few services gathered very large shares, while several other platforms competed for smaller but still meaningful segments of TV time. That structure puts pressure on mid-sized platforms to define why fans should return after a single show, sport, or franchise event ends.
Fan Engagement Signals For Programmers And Marketers
Platform Choice Became A Fandom Signal
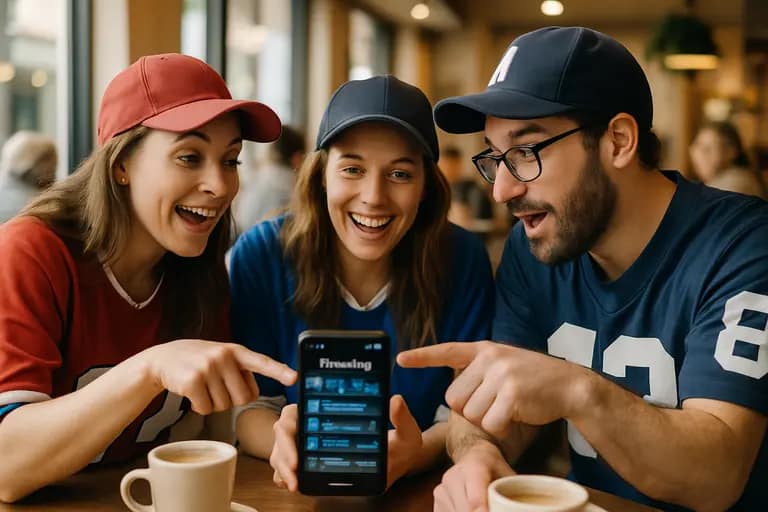
Market-analysis: when YouTube leads media distributors in May TV watch-time at 13.8%, the implication is not only technological. It suggests that living-room viewing had absorbed habits often associated with mobile and desktop video: creator subscriptions, clips, explainers, reaction formats, and algorithmic recommendations. The research does not separate creator content from other YouTube viewing, so any claim about creator-specific share would be unconfirmed. Still, YouTube’s total share confirms that entertainment culture on the TV screen was not limited to studio-programmed series and films.
For studios, this changes the launch plan. A trailer, premiere, or finale is no longer competing only with other scripted shows. It competes with highlight channels, recaps, fan essays, sports clips, podcasts, and platform-native personalities. Market-analysis: fandom becomes less centralized, even when viewing is measured on the same television screen. That makes community management, creator partnerships, and post-release explainers more useful for keeping attention active.
Event marketers face a similar challenge. A live event may deliver a spike, but the longer value often depends on the afterlife: clips, interviews, analysis, social conversation, and streaming availability. For readers interested in broader themes surrounding audience and event planning, Pilot Pointer provides relevant insights within our network of related coverage.
What Nielsen Gauge Data Means For 2026 Viewing
A Cautious Reading Of Audience Preference
Nielsen Gauge Data points to a clear preference for streaming access and ad-supported availability, but the safest interpretation stays within the evidence. Confirmed: streaming reached 48.6% of total U.S. TV watch-time in May 2026, and streaming services reached a record 46.6% share of ad-supported TV viewing in Q1 2026. Market-analysis: viewers appeared willing to give major attention to streaming platforms when the programming mix included live sports, premium originals, and large entertainment franchises.
Opinion, based on the confirmed data: the cultural importance of these figures is that streaming had become both a distribution system and a fan behavior system. People did not only use streaming to replace a channel bundle. They used it to follow events, revisit series, sample platform libraries, and move between professionally produced and platform-native video. That shift affects how media companies define reach. It is no longer enough to count availability. The stronger question is whether a platform can convert a viewing moment into repeat attention.
For 2026 planning, the evidence supports three careful takeaways: streaming was near half of total TV watch-time in May; ad-supported viewing remained central in Q1; and platform power was uneven, with YouTube and Netflix far ahead of many competitors in the May share list. Nielsen Gauge Data does not answer every demographic or loyalty question, but it gives a firm measurement base for judging how audience preference, fan engagement, and monetization were moving through U.S. television in 2026.


