
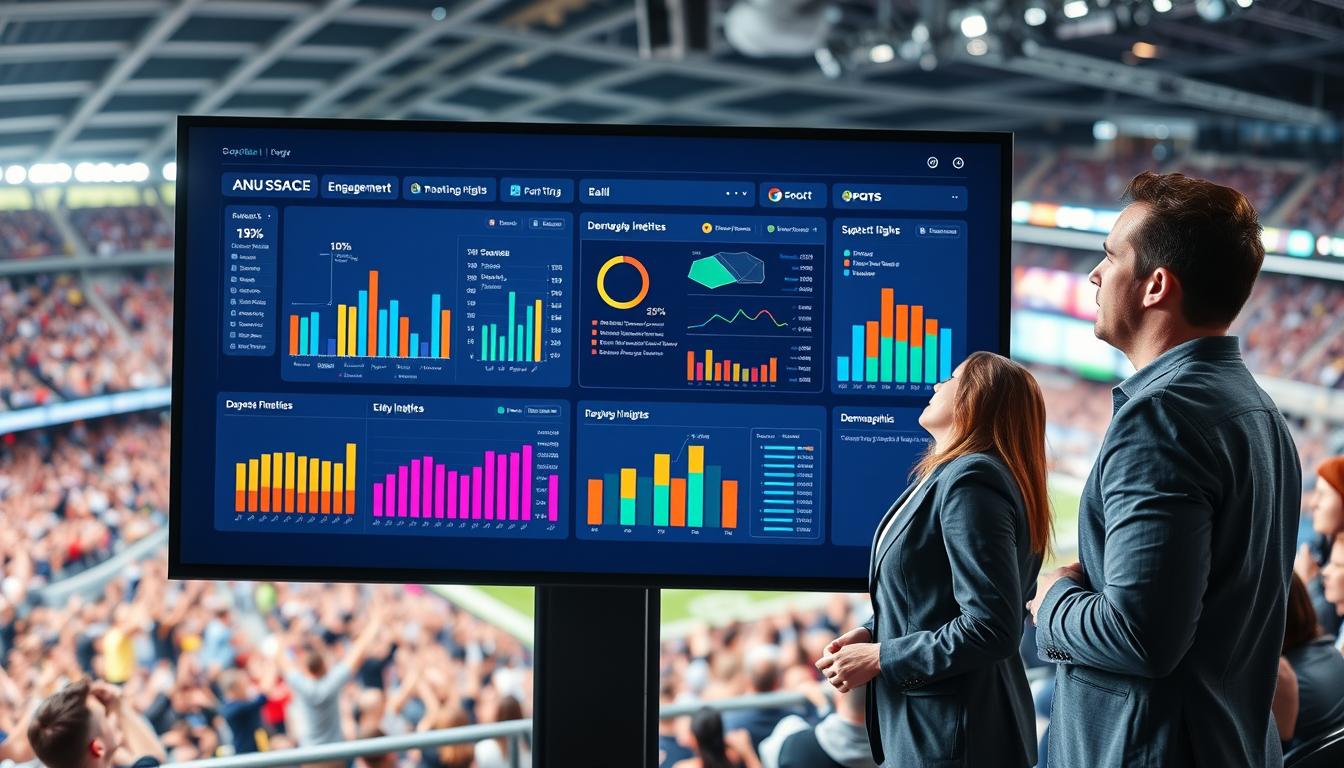
Remember when counting fans in the stadium was enough? That’s like using a rotary phone to scout players. It’s outdated.
Today, the action is online. It’s in social media, digital chatter, and silent clicks on videos. There’s a world of data waiting to share a story.
Gone are the days of guessing what fans want. Modern fandom is complex, tracked across every interaction. It’s not just about if fans showed up. It’s about why they stayed, what they shared, and what will keep them coming back.
This process is the new playbook. It turns random data into a clear story. This is the power of audience engagement analytics: making guesses into plans and fans into partners.
Fan Journey Mapping
Think of fan journey mapping as forensic psychology for sports fandom. We’re piecing together a digital crime scene of emotional investment. It’s less about where fans are and more about how they got there. That first ticket purchase is like the pilot episode. The 3 AM highlight replay is like the season finale.
This isn’t cute flowchart territory. We’re stitching together narratives from digital breadcrumbs across apps, social media, and ticket scanners. The goal is to create the “Emotional Arc of Fandom.” When does a casual observer become a fanatic? More importantly, when do they start eyeing the exit?
Modern audience engagement analytics turns this from guesswork to science. We unify data from ticketing platforms, mobile apps, social media, and merchandise sales. The result is a single fan profile that tells their complete story.
Consider this progression. It’s messier than any Netflix algorithm but far more revealing:
| Stage | Fan Behavior | Critical Data Points | Emotional Marker |
|---|---|---|---|
| Discovery | First exposure through social media, news, or friends | Social media impressions, website first visits, free content downloads | Curious but uncommitted |
| Exploration | Checking schedules, watching highlights, following players | App downloads, newsletter sign-ups, video replay counts | Growing interest with low investment |
| Engagement | First ticket purchase, joining fan forums, wearing team colors | First transaction, forum participation, social media follows | Emotional investment begins |
| Advocacy | Season ticket holder, defending team online, recruiting friends | Repeat purchases, social shares, referral activity | Full identification with team |
| Churn Risk | Decreased activity, canceled subscriptions, negative comments | Inactivity periods, support tickets, sentiment analysis | Disengagement or frustration |
Notice the plot twists? That abandoned merchandise cart after a loss isn’t just lost revenue. It’s an emotional data point. The angry tweet isn’t just noise—it’s a temperature check on fan sentiment.
Mapping this journey reveals the precise moments that matter. Was it the playoff victory that converted casual viewers? Or the community outreach program that built loyalty? Without audience engagement analytics, you’re guessing. With it, you’re reading the emotional script of your fanbase.
The real magic happens when these journeys aren’t viewed in isolation. Patterns emerge. You might discover that fans who engage with mobile app push notifications convert to season ticket holders 40% faster. Or that social media interactions during away games predict merchandise purchases better than win-loss records.
This is where journey mapping becomes strategic. It’s not just understanding where fans are today. It’s predicting where they’ll be tomorrow. Will that Discovery-stage fan become an Advocate? Or will they quietly exit during the Exploration phase?
The data tells the story. Your job is to become the editor—shaping narratives, enriching plotlines, and avoiding those cancellation-worthy cliffhangers. After all, in the drama of sports fandom, every data point is a character development moment.
Engagement Touchpoint Analysis
Looking at fan touchpoints is like reading tea leaves. Each interaction tells a story. Ticket purchases, app downloads, and social media comments are all part of a big story. My job is to understand their emotional and strategic value.
The touchpoint ecosystem is complex. It includes easy ticket checkout, smooth app use, and timely emails. Each interaction is a conversation, even if it’s one-sided. The post-game survey and beacon notifications are all touchpoints.
We need to look beyond simple metrics. Likes and shares are just applause. We must know if fans stayed for more. Did personalized messages from players increase loyalty, or were they ignored?
True fan engagement metrics show what fans really want. They reveal if the relationship is strong or just transactional. A fan might buy lots of merchandise but not engage online. Another might watch every game but never go to the venue.
This is like checking a fan’s health. We look for signs of engagement, emotional connection, and consistent behavior. Tools for customer engagement analytics help us understand these interactions better.
The main goal is to find meaningful interactions. We want to know what truly connects fans to brands. Often, the most important touchpoints are the ones that make things easier or surprise fans. These are where loyalty is built, not in big shows but in smooth experiences.
Social Media Interaction Patterns
If you think social media metrics are just vanity counters, you’re missing the psychological opera playing out in every comment thread. This is where fandom gets performative, raw, and deliciously analytical. The numbers—likes, shares, retweets—are merely the opening act.
The real show is in the qualitative data hiding between the lines. A comment thread dissecting a coach’s decision reveals more about fan intelligence than any survey. A meme that goes viral within minutes of a loss tells you about the community’s coping mechanism. This is audience engagement analytics at its most human.
Sentiment analysis tools can classify reactions as positive, negative, or neutral. But I’m looking for the subtext. Is the anger after a defeat focused and constructive, or is it nihilistic rage? Is the joy after a win smug or communal? These emotional fingerprints dictate whether your fanbase is resilient or fair-weather.
You start to see tribal patterns emerge. The “deep divers” engage in long threads, quote-tweet with analysis, and represent your core loyalists. The “reactors” flood with emojis and short bursts of emotion—valuable for volume but shallow on commitment. The “archivists” save and share every highlight, building the community’s mythology.
Then there are the unexpected data points. Which third-string player became a Twitter cult hero for their sideline antics? Which sponsor’s hashtag was hijacked for jokes? These aren’t anomalies; they’re cultural indicators. They show what the community values beyond wins and losses: personality, humor, authenticity.
Tracking these patterns transforms content strategy from broadcasting to conversing. You learn when to be solemn, when to be celebratory, when to lean into self-deprecating humor. Mastering this social listening turns your brand into a participant, not a lecturer. For a deeper dive into quantifying these interactions, explore this guide to essential social media metrics.
The goal isn’t just to report on audience engagement analytics. It’s to interpret the story they tell. That story informs everything from crisis communication to celebration posts. It tells you how to speak with your audience, not at them.
In the end, social media is the focus group that never adjourns. The patterns are always shifting, always revealing. The smartest organizations aren’t just counting mentions—they’re decoding the language of their own fan tribe.
Mobile App Usage Analytics
Think of your team’s mobile app as a direct line to fans’ hearts. It’s their most personal touchpoint. It’s not just about how many downloads you get. It’s about if fans use it every day or forget it exists.
True audience behavior analysis happens in the quiet moments and quick taps. We dive into the “why” behind fan actions. Did a new feature, like augmented reality, become a favorite or just a one-time thing? Analytics show us the truth.

The magic is in the connections you make. For example, does watching a player’s mic’d up moment on the app boost jersey sales? I’ve seen teams turn their app into a powerful tool. They add real-time stats, fantasy games, and exclusive content to keep fans engaged.
Let’s look at the key metrics that make an app valuable. The table below shows what matters, what it measures, and how it helps.
| Metric | What It Measures | The Real Insight | Actionable Example |
|---|---|---|---|
| Session Duration & Frequency | User stickiness and habitual use. | Is the app a destination or a quick stop? Long, frequent sessions indicate deep integration into fan routines. | The NBA App personalizes highlight reels, driving average session times up and contributing to a 30% increase in user interactions. |
| Feature Adoption Rate | Utility and innovation acceptance. | Which features are hits (play-by-play alerts) and which are misses (complex gamification)? Identifies what fans truly value. | Low adoption of a new “trivia” feature signals a need to rework or replace it with something more aligned with fan desires. |
| User Journey & Drop-off Points | Friction in the in-app experience. | Pinpoints where fans abandon tasks (e.g., during ticket purchase or video playback). This is your app’s pain point diagnosis. | A 40% drop-off at the payment page indicates a technical or usability issue that needs immediate fixing. |
| In-App Purchase & Conversion | Direct commercial impact. | Links content engagement to revenue. Does viewing exclusive content lead to merchandise sales? | Correlating spikes in “behind-the-scenes” video views with jersey sales in the integrated store proves content ROI. |
| Push Notification Engagement | Effectiveness of direct communication. | Are your alerts welcomed news or ignored spam? Open rates and subsequent actions tell the tale. | A push about a key player injury has a 90% open rate but zero follow-on clicks, suggesting the message lacked useful next steps or context. |
This detailed audience behavior analysis is what makes a difference. It shows if your app is convenient or connects fans. The data is clear. When session times go up after adding real-time stats, you know you’ve added value. When fans buy tickets after watching a video, you’ve built a commerce engine.
The goal is to make your app a key part of fans’ lives. Use every interaction to create a better, more indispensable experience. The phone is always on. Your engagement shouldn’t sleep.
Website and Digital Platform Metrics
Your website analytics are like a digital security camera. They show you who visited and what they did. It’s not just about counting visitors. It’s about understanding their actions.
Your site is like a 24/7 headquarters. Is it bustling or empty? The metrics help you figure this out. They highlight busy areas and quiet spots.
Every click tells a story. A visitor in the archives is different from one checking live stats. One is curious, the other is a fan. True audience engagement analytics connects these stories.
The core metrics tell the story. Let’s look at the key signals:
| Metric | What It Measures | The Strategic Insight |
|---|---|---|
| Page Views & Unique Visitors | Raw traffic volume and reach. | Is your content or campaign drawing a crowd? This is your top-line attendance figure. |
| Average Time on Page | Depth of engagement with content. | A long stay on a player profile suggests high interest. A quick exit from a merch page suggests a problem. |
| Bounce Rate | The percentage who leave after one page. | A high rate is a red flag. It means the page didn’t match the visitor’s expectation or failed to engage them. |
| Navigation Paths (User Flow) | The journey visitors take through your site. | Do most fans go from a game recap to ticket info? That’s a powerful conversion path to optimize. |
| Conversion Rate | The percentage completing a goal (sign-up, purchase). | The ultimate measure of effectiveness. Which calls-to-action are green lights, and which are dead ends? |
Raw data is just noise. The magic happens in the dashboard. Tools like Tableau or Google Looker Studio turn numbers into stories. You see how visitors move from one step to another.
The final step in audience engagement analytics is connecting the dots. By linking website data to your CRM, you get a complete picture. An anonymous visitor becomes a lead. You can then tailor content to them, leading to a sale.
So, stop just watching the traffic. Start interpreting the journey. Your website metrics are the most honest scout you have, telling you exactly what your digital franchise is doing right—and where it’s failing to convert.
In-Venue Behavior Tracking
The modern sports arena is more than just a place to watch games. It’s a place where every action is data. From steps taken to hot dogs bought, it’s all about the numbers.
Imagine your stadium as a huge focus group. Instead of asking fans what they want, we watch what they do. Wi-Fi and Bluetooth help us see how fans move and what they do.

The goal is to make the stadium “smart.” It should react to what’s happening in real-time. This means using data to manage the event as it happens.
For example, if a concession line is getting long, we can send mobile vendors or text fans to order from their seats. If a gate is crowded at halftime, we can quickly move staff to help.
This smart thinking turns guesses into solid plans. A stadium once found that long bathroom lines hurt sales at nearby stores. Fans were too busy to shop.
To fix this, they added more bathrooms and let fans order food on their phones. Sales in that area went up 22%. It shows that making things easier can really help business.
Here’s what in-venue tracking usually looks at:
- Crowd Flow & Congestion: How fans move around during breaks.
- Concession Demand Analytics: What sells where and when, helping with stock and menus.
- Queue Length & Wait Times: Monitoring lines for food, restrooms, and entry gates.
- Dwell Time & Engagement Zones: Where fans like to hang out and socialize.
The tech behind this isn’t fancy. It uses beacons and Wi-Fi to track fans. The key is linking this data to sales and other systems.
At halftime, the stadium might look chaotic. But analytics sees a clear pattern. Fans go to concessions, restrooms, or stay seated. Knowing this helps staff and even offers discounts.
The real value of tracking fans in person is its honesty. Online, fans might say they like vegan hot dogs. But in the stadium, they buy bratwursts. This shows what fans really want.
This creates a cycle of improvement. Bad bathrooms mean lost sales. A hit food item shows up in sales data, not just social media. It turns complaints into business facts.
In the end, tracking fans in person completes their profile. We see their whole journey, from online to in-person. It shows that every step has a value.
Purchase Pattern Analysis
The real talk between fans and teams happens at the checkout. Every purchase shows true support, beyond just likes and shares. This is where audience engagement analytics truly shines.
We look at ticket sales, merchandise, and concession spending. Each shows a different story. Ticket sales show how committed fans are. Merchandise sales reveal how much fans identify with the team. Concession spending tells us about the in-game experience.
This data helps teams set prices wisely. It’s not about charging too much. It’s about adjusting prices based on the game, weather, and demand. Prices might drop for less popular games and go up for big matchups.
The key is fan lifetime value (LTV). It’s how much a fan will spend over time minus what it costs to get them. This helps teams focus on their most valuable fans.
Analysis also finds fans at risk of leaving. If a season ticket holder stops buying merch, or if concession spending drops, it’s a sign. These fans might be losing interest, even if they don’t show it online.
Small, regular purchases can show deep loyalty. Fans who buy monthly collectibles or have recurring donations are often the most dedicated. These small actions create a strong financial bond.
This analysis paints a full picture of audience engagement analytics. You’ve seen how fans interact, spend, and behave at games. Now you know their financial bond with the team. It’s a unique sign of their fandom.
The key takeaway is clear. Use purchase patterns to tailor offers, predict earnings, and keep fans engaged. When you know how fans spend, you know what they value most. This is the secret to lasting fan support.
Demographic Segmentation Insights
Remember when marketing was a megaphone blast to a faceless crowd? That’s the old playbook. Today’s winning strategy in audience engagement analytics is a whispered conversation with a friend.
Demographic and psychographic data slices the monolithic “fan” into vibrant personas. I build archetypes: the urban Gen Z esports enthusiast, the suburban family planning a weekend ritual, the international follower connecting through social justice initiatives. This isn’t guessing. It’s precision. Manchester City’s Cityzens platform uses this segmentation to tailor content, reportedly boosting engagement by 40%. An offer for a family package never reaches the single college student. That’s the power of knowing who you’re talking to.
This is the final, critical layer. We’ve mapped journeys and tracked touchpoints. True audience engagement analytics asks not just what fans do, but who they are. Their age, location, values, and media diet complete the picture. Without this, you’re analyzing shadows.
So forget broadcasting. Embrace narrowcasting. When you speak directly to a persona’s core motivations, engagement stops being a metric and starts being a relationship. That’s how you turn data into devotion.