
Remember the sports sage? The grizzled coach puffing a cigar, making calls based on gut instinct and hope? That archetype is now a museum piece.
We’ve traded intuition for integers. Welcome to the era of Moneyball on digital steroids. Every action is now measurable. This isn’t just about counting points anymore. It’s about using algorithms to control the game.
Think about Leicester City’s 2016 Premier League miracle. Was it just magic? Hardly. It was math in cleats—a masterclass in using data to defy odds. That fairy tale signaled a permanent shift.
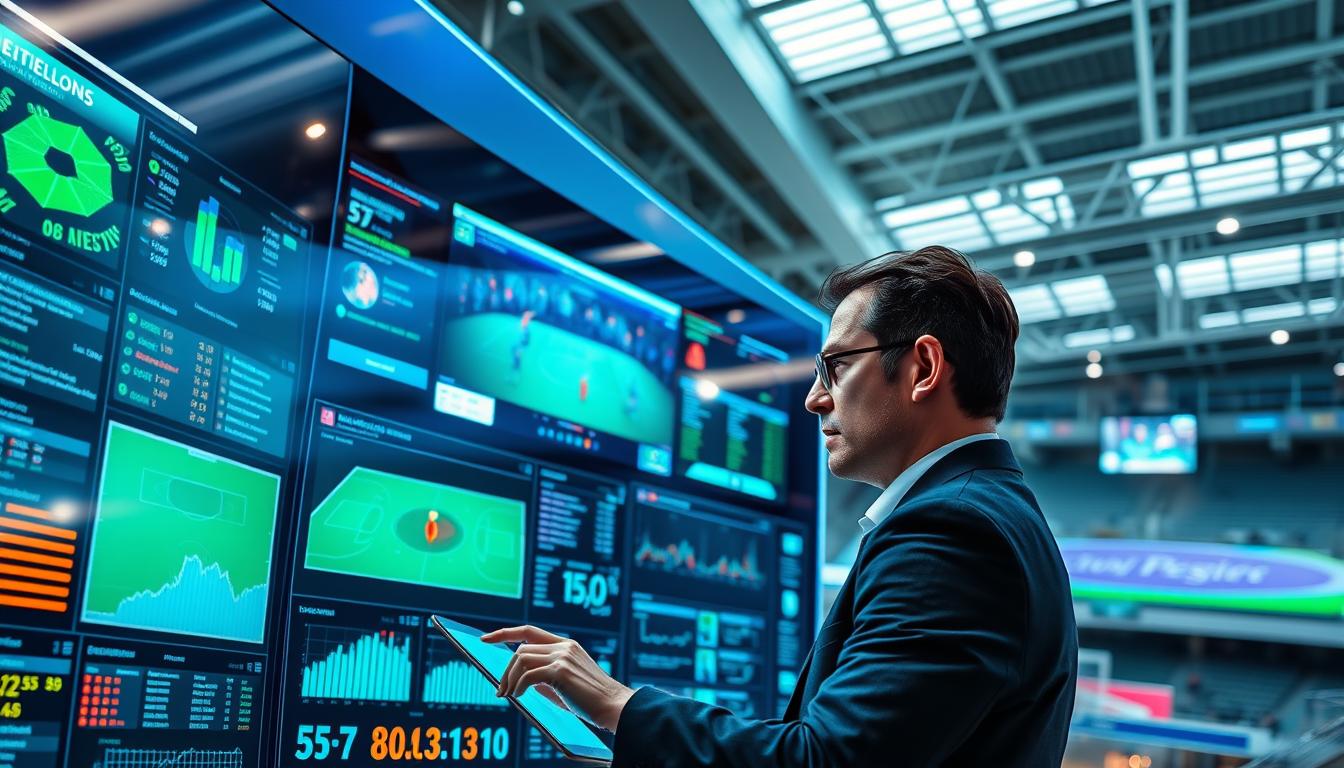
The game has evolved from reactive to predictive. Today, the true power isn’t always with the screamer on the sideline. It’s with the analyst in the press box, whose dashboard pulses with live insights. This enables how sports analytics enhances efficiency and.
I’m here to unpack the toolbox. We’re moving from guessing to knowing. This is the art and science of real-time optimization.
Essential Real-Time Analytics Platforms
The stadium roar tells one story, but the data tells another. Every move in sports now creates digital echoes. This is the world of essential real-time analytics platforms that turn chaos into structured intelligence.
These systems are like the arena’s nervous system. They don’t just record results; they capture the whole action. Without them, understanding sports is like reading a symphony program without listening to the music.
The NBA’s SportVU system tracks every player and the ball 25 times a second. It’s like a digital panopticon, capturing every detail. This isn’t just watching; it’s digital dissection.
The NFL’s Next Gen Stats use sensors in shoulder pads. They measure a quarterback’s release time and a receiver’s speed with GPS. It shows not just if a play failed, but exactly how and when.
MLB’s Statcast is a data beast, capturing 7 terabytes per game. It’s like streaming “Game of Thrones” in 4K twice during a game. It measures everything from exit velocity to spin rate, making us debate the physics of a curveball like a thesis.
These platforms are key to live event analytics. They go from “he’s fast” to knowing his exact speed and acceleration. This changes coaching, broadcasting, and how we watch games from home.
The revolution isn’t just for pros. Wearables and sensors give detailed biometric data in amateur and college sports. Heart rate, muscle load, and fatigue indicators turn athletes into data transmitters. This isn’t future tech; it’s today’s edge.
| Platform | Sport | Data Capture Rate | Signature Metrics | Scale |
|---|---|---|---|---|
| SportVU | NBA Basketball | 25 times/second | Player positioning, ball tracking, movement efficiency | Comprehensive arena coverage |
| Next Gen Stats | NFL Football | Continuous sensor streaming | Speed, acceleration, separation, release time | Player-level sensor networks |
| Statcast | MLB Baseball | High-frequency optical tracking | Exit velocity, launch angle, spin rate, route efficiency | 7+ terabytes per game |
| Wearable Arrays | Multiple Sports | Real-time biometric monitoring | Heart rate, workload, fatigue metrics, muscle activation | Individual athlete tracking |
What makes these systems essential? They give us the ground truth. While commentators offer opinions, these platforms give us physics. They settle debates about who was open or if a pitch crossed the corner.
The table shows how each system works differently. SportVU uses cameras, Next Gen Stats sensors, Statcast radar and cameras, and wearables track biometrics. They all aim to eliminate guesswork.
Adding this layer of live event analytics is no longer optional. It lets teams adjust strategies based on real data. It changes how we watch games, showing us angles we never saw before.
So, when you watch a game tonight, remember: you’re seeing the performance, but these platforms capture the reality. They’re the unblinking eyes that never miss a detail, turning human excellence into data poetry.
Setting Up Live Event Dashboards
Setting up a live event dashboard is like building mission control for a rocket launch, but the rocket is a hockey game. You have a million data points screaming for attention—heart rates, sprint distances, puck possession stats. Without a central command, it’s just noise. The true power of modern sports event technology isn’t the data collection; it’s the curation.
The Dashboard as Your Command Center
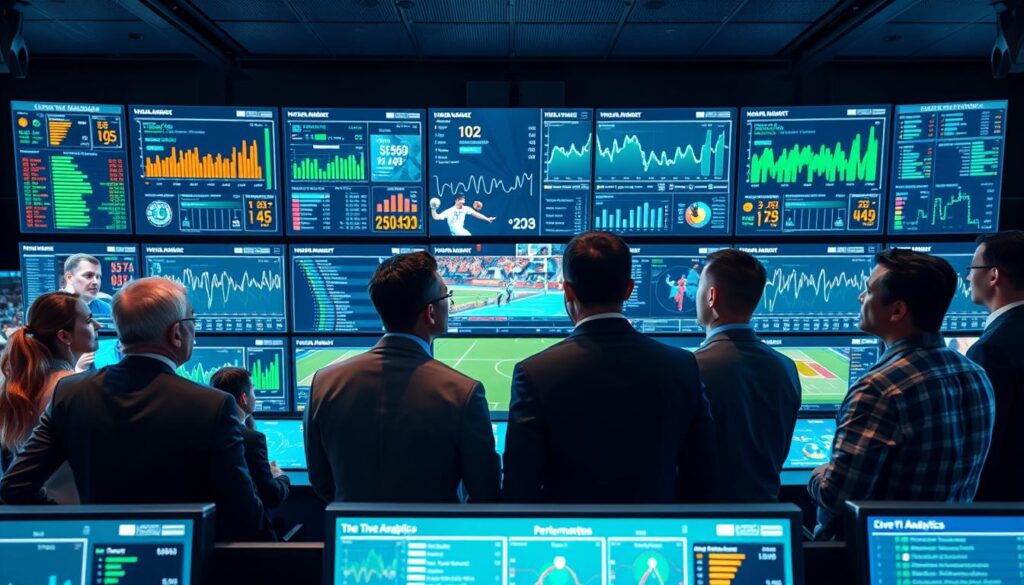
Forget spreadsheets. Think of a giant screen, alive with color-coded maps and flashing metrics. This is where raw information becomes insight. A coach isn’t looking at a number; they’re looking at a story.
A story about a defenseman whose GPS-derived “fatigue index” just spiked into the red zone in the third period.
That spike isn’t just data. It’s a prediction. It says, “This player is about to make a costly mistake.” The dashboard allows you to see that prediction in real-time, not in tomorrow’s post-game report. This is the shift from reactive to predictive management.
From Data Points to Game-Changing Decisions
Let’s get specific. In baseball, sports event technology like Statcast provides live spray charts. A manager sees a left-handed power hitter at the plate whose last ten hits have been pulled to right field. The dashboard visualizes this tendency as a heat map.
The decision is instant and visual: shift three infielders to the right side. The technology didn’t make the decision, but it presented the evidence so clearly that the choice became obvious.
Wearable devices from companies like Catapult stream biomechanical data. A soccer manager can see a midfielder’s explosive power dropping, signaling it’s time for a substitution before a key defensive lapse.
This table breaks down how different dashboard metrics translate into immediate action:
| Dashboard Metric | Sport Application | Data Source | Real-Time Decision Impact |
|---|---|---|---|
| Player Load & Fatigue Map | NBA Basketball, NFL Football | GPS & Accelerometer Wearables | Substitute a player before injury risk peaks or performance plummets. |
| Expected Goals (xG) Meter | MLS Soccer, NHL Hockey | Optical Tracking & Historical Data | Adjust offensive strategy based on the quality, not just quantity, of shots taken. |
| Defensive Positioning Heatmap | MLB Baseball | Statcast Radar Tracking | Execute an infield or outfield shift to neutralize a batter’s proven tendency. |
| Heart Rate Zone Monitoring | International Rugby, Marathon Racing | Biometric Wearables | Manage athlete exertion levels during critical phases of a long-duration event. |
Building Your Visual Narrative
So, how do you build this? It’s not plug-and-play software. It’s a design philosophy. You must ask: What is the one piece of information I need in the next 30 seconds? Your dashboard should answer that question at a glance.
You curate the metrics like an art gallery selects paintings. Too much clutter, and the masterpiece is lost. The goal is a clean, visual narrative that allows for decisions at the speed of the game itself. This is the art behind the sports event technology—transforming a server farm’s worth of data into a single, actionable glance at a screen.
Your dashboard is your lens. It focuses the chaotic light of live data into a sharp beam of insight. Without it, you’re just guessing.
Social Media Monitoring Tools
Social media monitoring has changed a lot. It’s now about understanding emotions, not just counting likes. It’s like doing a live study of a fanbase’s feelings.
Today, there are two crowds: the ones in the seats and the digital ones online. The online crowd reacts instantly, giving you real-time feedback. This feedback is gold for real-time optimization of your event.
Sentiment analysis tools are key. They don’t just count good or bad comments. They understand the subtleties, like the difference between genuine praise and sarcasm. It’s like having a mood ring for your audience.
During a big controversy, these tools show who’s upset with whom. This info helps you respond wisely, not just randomly.
Building fan personas is the real magic. Advanced tools can spot different audience types:
- The Stats Nerd: Loves data, debates with it
- The Emotional Die-Hard: Reacts strongly to every play
- The Casual Observer: Asks simple questions, enjoys the fun parts
- The Meme Lord: Creates funny content about the event
Segmenting your audience matters a lot. During a delay, you can send specific content to each group. It’s like having different food stands for different tastes.
This approach makes social listening proactive. You can prepare for negative trends before they get worse. And you can boost positive moments with the right content.
Choosing the right tool is key. Here’s how top platforms compare:
| Tool Name | Primary Function | Key Metric | Best For |
|---|---|---|---|
| Brandwatch | Sentiment & Trend Analysis | Emotion Score | Large-scale brand perception tracking |
| Sprout Social | Engagement & Response Management | Response Time & Sentiment Shift | Teams managing direct fan interactions |
| Talkwalker | Real-time Alerting & Crisis Detection | Alert Velocity | Identifying emerging issues before they explode |
| Hootsuite Insights | Cross-platform Performance | Engagement Rate by Platform | Understanding where your audience is most active |
| Mention | Competitor & Influencer Tracking | Share of Voice | Seeing how you stack up against rivals |
Platforms like Sprout Social turn data into useful insights. They help you understand what people really mean by their comments.
The goal is to make your social media responses feel natural. When the crowd boos, acknowledge their frustration. When they cheer, amplify that excitement.
This isn’t just about managing your reputation. It’s about engaging real-time optimization. You’re not just listening; you’re joining the conversation with smart responses.
The tools have improved, but the core is human. Understand your audience, speak their language, and respond to their feelings. In today’s sports world, this happens fast, turning noise into strategy.
Audience Flow and Heat Mapping
The same tech that tracks a linebacker’s moves now maps your fans’ path from parking to premium seats. We’ve studied player tracking for years, from rugby GPS to NBA jerseys. But what about the 70,000 fans who paid to watch? Their movement tells a story as rich as any athlete’s.
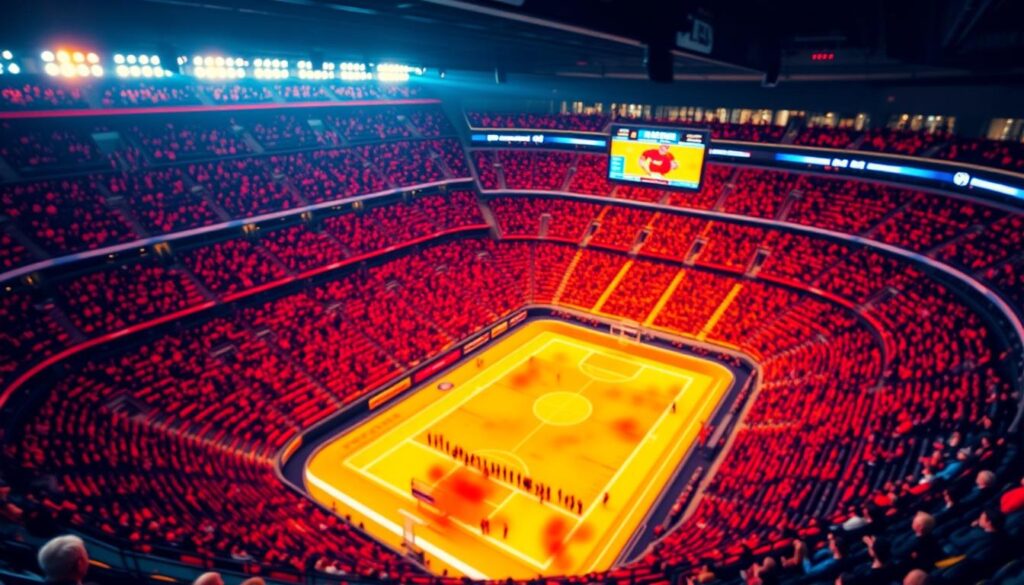
A coach’s heat map shows LeBron’s dominance in the paint. An audience heat map reveals where your concession lines are bottlenecks. It’s about understanding patterns to improve experiences, not surveillance.
So, how does live event analytics work its magic? The data streams are surprisingly simple:
- Wi-Fi and Bluetooth pings: Anonymous signals from smartphones paint real-time movement paths.
- Ticket scan analytics: Not just entry times, but progression through different zones with RFID or digital tickets.
- Camera vision analytics: Modern systems count crowds, gauge density, and track flow without identifying individuals.
- POS system data: When and where purchases happen reveals where people congregate.
Your stadium isn’t static; it’s a living organism with circulatory systems. You can see the craft beer stand getting crowded during the seventh-inning stretch. You spot the quiet areas in sponsor zones during halftime.
The operational applications are immediate. See a “heat blob” at a popular food vendor? Send a mobile cart to relieve pressure. Notice a “cold spot” in a fan interaction zone? Trigger a push notification for a free scarf or drink voucher to drive traffic. It’s crowd control with surgical precision.
This is where live event analytics shifts from the front office to the front lines. Your security team can anticipate pinch points before they become problems. Your hospitality staff knows which suites are busy versus empty. Your marketing team understands which fan attractions work.
Remember Source 2’s insight about understanding fan behavior patterns for personalized experiences? Heat mapping is that insight in visual form. We’re using rugby player positioning data to optimize the fan journey.
The result? You’re not just hosting an event; you’re conducting it. Every decision, from staffing to signage to promotions, can be data-informed in real time. The physical experience becomes as optimized as the digital one.
In the end, live event analytics through audience flow mapping does one profound thing: it treats the fan’s time and comfort as valuable as the athlete’s performance. And in today’s experience economy, that might be the most strategic play of all.
Live Streaming Performance Metrics
Real-time metrics have changed how we watch sports. Fans now manage their own data feeds. This is thanks to sports event technology that makes watching an interactive sport.
The broadcast is now your control center. You’re not just watching; you’re directing. You choose what stats to see or which audio to listen to. This change means we need new ways to measure success.
The NHL’s “STEMcast” is more than a hockey game. It’s an animated, educational experience. It teaches physics and geometry through play.
Amazon’s Prime Video NFL coverage uses AI to predict plays. Seeing a “Pressure Probability: 87%” alert before a blitz changes everything. It makes viewers feel like insiders with predictive intelligence.
So, what metrics really matter now? Traditional ratings are just the start. The real insights are deeper.
| Metric | What It Measures | Why It Matters for Optimization |
|---|---|---|
| Average Engagement Time | How long a viewer stays actively connected to a single stream. | Shows how engaging the content is. A drop means viewers are bored. |
| Peak Concurrent Streams | The maximum number of viewers at once during an event. | Tests how well the system handles big crowds and shows peak interest moments. |
| Interactive Feature CTR | Click-through rate on stats overlays, polls, or camera angle options. | Shows how much viewers want to control the experience. |
| Feed Choice Demographics | Who chooses the “coach’s audio” vs. the “clean feed” vs. the “stats-heavy” view. | Helps personalize the experience. Shows which segments want deep analysis or entertainment. |
| Feed Choice Demographics | Who chooses the “coach’s audio” vs. the “clean feed” vs. the “stats-heavy” view. | Helps personalize the experience. Shows which segments want deep analysis or entertainment. |
| Buffer Rate & Latency | Stream stability and delay behind live action. | Essential for a smooth experience. High latency ruins real-time interaction. |
Optimizing a live stream is a two-part mission. First, ensure the stream is stable and fast. Second, offer compelling choices. This way, you let the viewer take control and analyze the game.
The best sports event technology doesn’t just show the game. It lets viewers dissect it in real-time. Success is not just about who saw the touchdown. It’s about who understood the coverage that made it possible.
Mobile App Engagement Tracking
The most intimate relationship in sports is between fan and mobile app. Every tap, swipe, and pause leaves digital fingerprints. These tell a story more revealing than any post-game interview. Your team’s app is a relentless real-time optimization engine, learning and adapting with each interaction.
Fantasy sports platforms now engage over 62 million users in North America alone. Sports betting apps use artificial intelligence to crunch data. They offer what feels like “informed” bets—a seductive promise of control in an unpredictable arena.
The app learns your preferences. It knows you check live scores first, then watch highlights, then tinker with your fantasy lineup. This isn’t magic; it’s sophisticated behavioral analytics. The tracking metrics are remarkably intimate.
Teams and leagues monitor session length, specific feature usage, and push notification open rates. This creates a continuous feedback loop. It’s the difference between blasting a generic ad and sending a curated jersey discount.
This hyper-personalization transforms the app into an algorithmic concierge. It anticipates needs you didn’t even know you had. The goal is seamless, automated relevance—content that feels personally delivered, not broadly broadcast.
The data enables a form of real-time optimization so precise it borders on prescience. If analytics show a surge in users accessing concession menus during the seventh-inning stretch, the app can instantly prioritize mobile ordering options. If a key player gets injured, the platform can immediately surface related news and fantasy substitution suggestions.
This isn’t about collecting data for data’s sake. It’s about fostering a continuous, automated conversation. Every interaction is both an input for the system and a tailored output for the fan. The app remembers your preferences, acknowledges your behaviors, and rewards your engagement.
Push notifications become less about interruption and more about timely value. Did your fantasy quarterback just throw a touchdown? Here’s the highlight and a stat breakdown. Is the game you’re watching going into overtime? Here’s a one-click option to extend your streaming session.
The most successful sports apps understand they’re not utilities. They’re dynamic companions to the fan experience. They provide context, convenience, and a sense of connection that transcends geography. The stadium might be miles away, but the app makes the action feel personal.
This constant loop of measurement and adaptation represents the pinnacle of fan relationship management. It turns anonymous users into understood individuals. In the crowded digital landscape, that understanding is the ultimate competitive advantage. The team that listens best through its app, wins.
Sponsor Activation Monitoring
The old days of just putting a logo on a screen are over. Today, sponsors want to see real results. They want to know how their money is making an impact at your event. This is where live event analytics becomes a key player.
We’re not just counting who’s watching. We’re tracking how they feel and what they do. Did a big moment happen near a sponsor’s sign? That’s not just a highlight; it’s a valuable moment. With the right tools, you can measure its worth in real-time.
The magic happens when you connect the dots. Seeing a spike in social mentions is one thing. But linking that to more people using a sponsor’s coupon is another. This shows sponsors that their investment is worth it.
Let’s talk about what you’re tracking. It’s all about digital engagement, foot traffic, and sales. Tools like social listening and beacon technology help you understand audience behavior. And point-of-sale data shows how promotions are working.
This isn’t about drowning sponsors in data. It’s about telling a story with numbers. You’re showing them how their brand became part of the event’s story. And proving their investment paid off.
The table below shows how sponsorship has changed from old to new.
| Metric | Traditional Sponsorship | Data-Driven Activation | Business Impact |
|---|---|---|---|
| Primary Focus | Logo Visibility & Impressions | Audience Engagement & Conversion | Shifts from cost to investment. |
| Key Measurement | Estimated viewership | Social mentions, app interactions, foot traffic heatmaps | Provides tangible, auditable metrics. |
| ROI Definition | Vague “brand lift” | Coupon redemptions, lead generation, content shares | Directly ties to sales or marketing goals. |
| Reporting Timeline | Post-event summary (weeks later) | Real-time dashboards & dynamic valuation | Enables agile, in-event optimization. |
| Partner Relationship | Vendor-client | Strategic business alliance | Fosters long-term, collaborative partnerships. |
To start, add data collection to your activations. Use hashtags, QR codes, and app offers to gather data. Your live event analytics platform will collect it all.
Now, you’re not just selling ad space. You’re selling a dynamic market for brand impressions. The value changes with the excitement of the game. This new model, powered by live event analytics, makes sponsorships more sophisticated and valuable.
In the end, good sponsor monitoring does more than justify budgets. It turns your event into a real media platform. You offer clarity in a busy market. And in business, clarity is priceless.
Crisis Management Through Analytics
The true test of sports event technology isn’t just winning. It’s how it handles a crisis. Think about it. What’s the real crisis in sports? It’s not losing a game. It’s a torn ACL in your star player during the playoffs.
Modern analytics tools can spot these crises early. NBA teams use wearable sensors and machine learning. They analyze data to find signs of injury risk before it’s too late. This is smart defense.
This tech goes beyond just training. It can also detect PR problems from controversial calls. And it can spot safety hazards from crowd flow. This tech turns crisis management into a smart, data-driven process.
The goal of all this analytics is simple. It’s not just about tonight’s game. It’s about making sure the show goes on tomorrow, next week, and for seasons to come. That’s the ultimate win.